The K-Means Clustering
One of the most popular cluster algorithms is the K-Means. It was firstly mentioned as “K-Means” in 1967 by James MacQueen, but Steinhaus(1956) can be considered the first one publishing his thoughts about an algorithms using the same principles as the today’s known k-means.
In general, K-Means can be classified as a partitioning cluster approach and as every cluster algorithm it tries to discover meanfully subgroups, or clusters, in a dataset. The observations in the respective clusters are relatively similar to each other and the observations between different clusters are quite different from each other.
In the following paragraphs, I am going to describe the algorithm in general, the underlying math and how to choose the k, number of clusters. After that, I’ll implement the algorithm from scratch to gain full knowledge about the inner functioning, for implementing it after that with the useful sklearn library. The article finishes with a discussion about the pros and cons of this approach.
The Algorithm
As the name already indicates, the K-Means algorithm makes use of the arithmetic mean to partition the dateset in k predefined, non-overlapping clusters.
To grasp the general concept, it’s worth to have a look on the following figure:
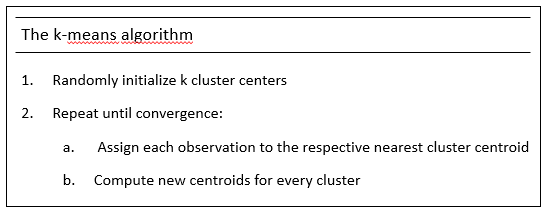
After having predefined the number of clusters, k randomly choosen observations of the dataset are assigned as centroids or cluster centers. Following up this first step, the other observations are assigned in 2.(a) to the nearest centroid forming eventually k first clusters.
Then in 2.(b), for each of the k clusters, a new respective centroid is computed. We finish this first iteration with k new centroids. As we can’t speak of convergence after the first iteration of the algorithm, we jump back to the step 2.(a) assigning the observations to the k new centroids.
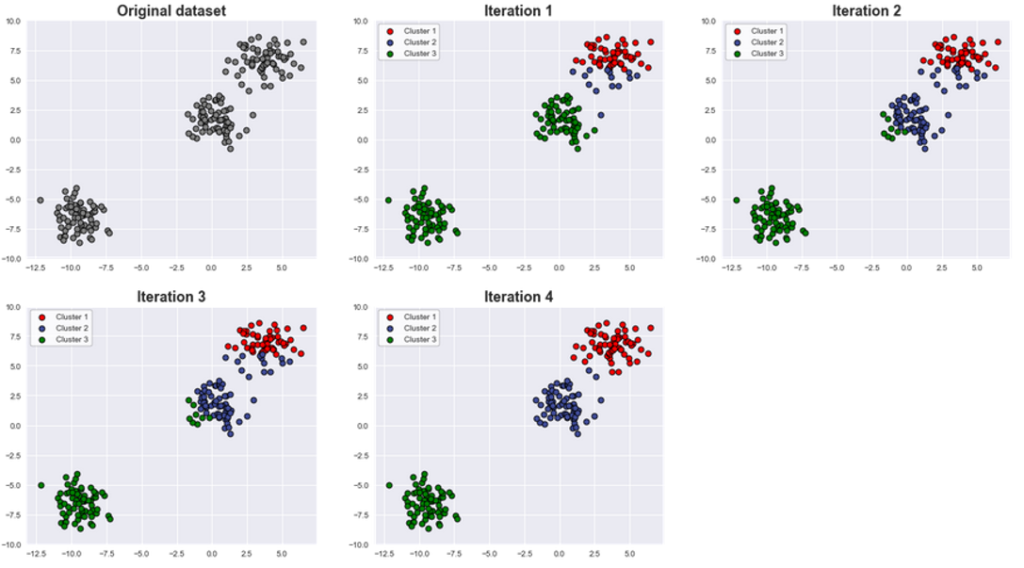
These two steps of assigning the observations to the new centroids and then recomputing new centroids will be repeated until the centroids and with them the cluster assignment of the observations stop changing.
The following graphics show how the clusters are changing with each iteration until convergence.
To understand how the algorithm really works and eventually how to implement it, it is mandatory to understand the math behind it. This topic will be explained in the following part of the article.
The underlying Math
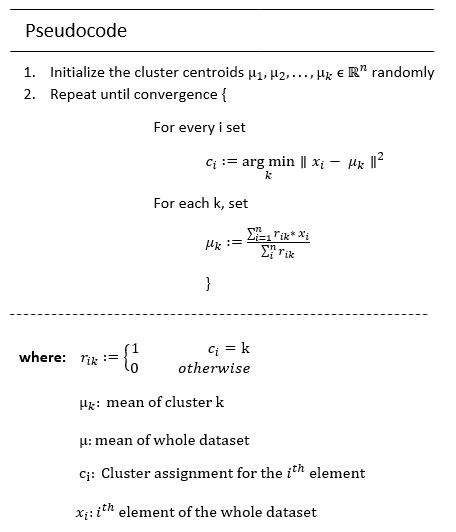
The logic of the algorithm should for now be quite easy to understand. To put the algorithm in a more mathematical form, it is useful to have a look on the approach in pseudo-code:
Total SSE\ (T)=\ Within Cluster SSE\ (W)\ +\ Between Cluster SSE\ (B)
T=W+B
W=T\ -\ B
\min {W\ {\Leftrightarrow}\ \max{B}}
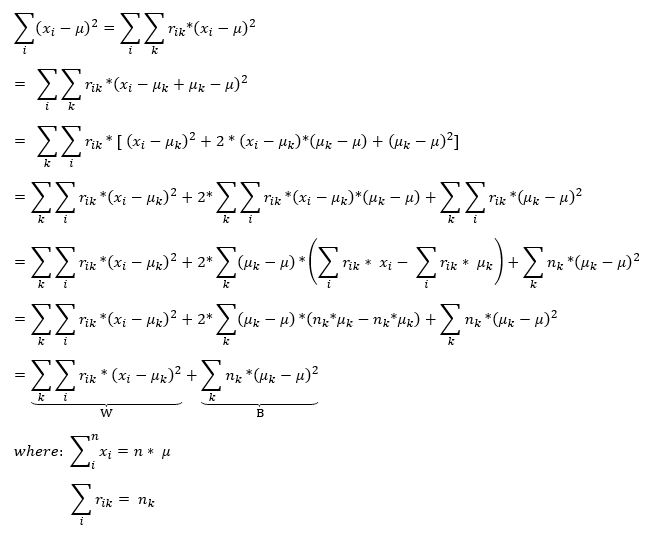
Out of this reasoning follows hence, that it is possible by minimizing the within-cluster-SSE to maximize the between-cluster-SSE. In this way, the observations of the clusters built from this algorithm are quite near to each other with low variance and the cluster themselves are quite far away from each other. To find the Within-Cluster-SSE, we can split the T in W and B:
W=\sum_{k}\sum_{i}{r_{ik}\ *\ \left(x_i-\mu_k\right)^2}
to
\frac{d}{d\mu}\ W=2\ast\left(-1\right)\ast\sum_{k}\sum_{i}{r_{ik}*\left(\ x_i-\mu_k\right)=0}
2\ \ast\sum_{k}\sum_{i}{r_{ik}*\ x_i-2\ *\sum_{k}\sum_{i}{r_{ik}*\left(x_i-\mu_k\right)}=0}
\mu_k=\frac{\sum_{k}\sum_{i}{r_{ik}*x_i}}{\sum_{k}\sum_{i}\ r_{ik}}
But why is the mean the best measure to optimize this function and not any other number?
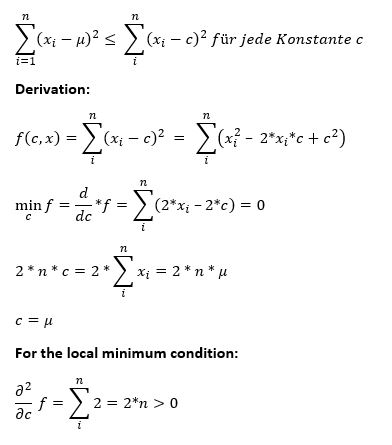
f(C,c)=\sum_{C;i=1}^n (x_{i} -\mu)^{2}+|number \,of\,elements\,in\,C|*(c-\mu)^{2}
For example take the dataset: C=\left\{6,8,9,11,16\right\}
with:\ \ \ \ \ \ \sum_{C:\ i=1}^{n}{x_i=50}
\ \ \ \ \ \ \ \ \ \ \ \ \ \ \ \ \ \mu=\frac{1}{n}\sum_{C:\ i=1}^{n}{x_i=} 10
For the mean, this signifies:
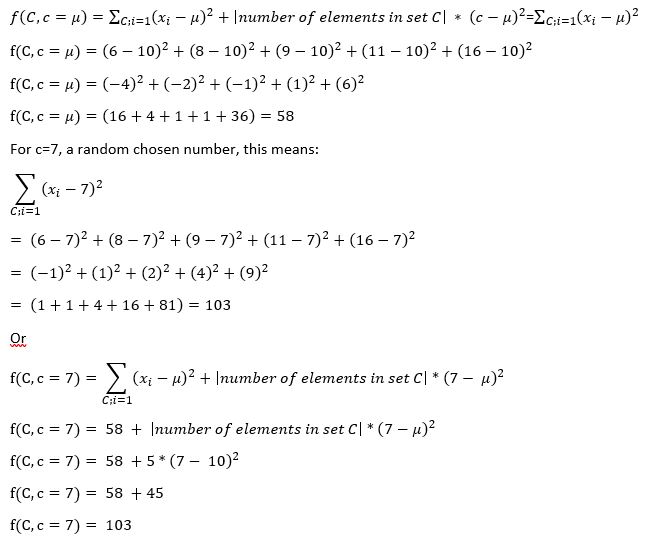
Out of this reasoning, it follows that for every randomly or purposely chosen number c, the result of this expression \sum_{i}^{n}{\left(x_i-c\right)^2\ \ } will be always \left|number\ of\ elements\ in\ set\ C\right|\ \ast\ \left(c-\mu\right)^2 higher than the result using the mean \mu .
After having grasped now the math behind the algorithm, the further question arises, in which way we could choose in advance the number of clusters k without having knowledge about the dataset.
Choosing k in K-Means
The concept as well as the mathematics behind the algorithm should for now be clear. When applicating the algorithm to a dataset, in the best case you are already aware of the number of clusters because you’ve got the necessary background knowledge about the dataset or the number of clusters are clearly defined. But you could also get in situations where the number of clusters in the dataset you want to examine aren’t fixed at all. In this case the k-means algorithm still needs the parameter to work out, but you are faced with the challenge to provide a reasonable number of clusters which results in a well-defined, optimal clustering.
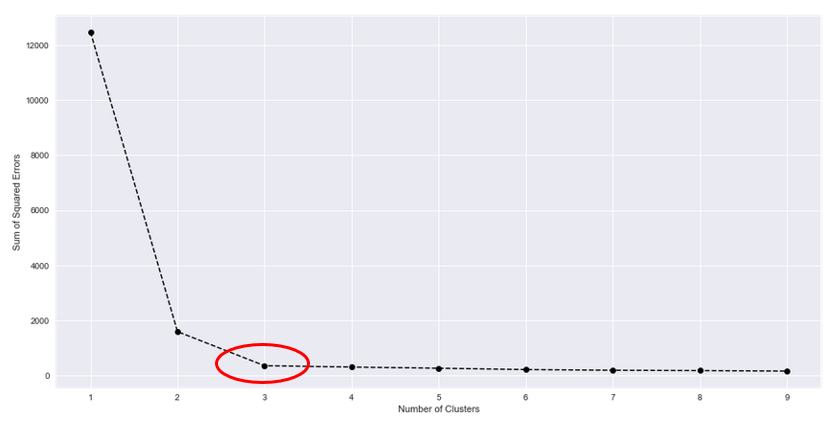
The most popular method to get to know the optimal number of clusters is the so-called “Elbow-Method“. It represents a visual solution to our problem and the concept is simple, but quite effective. To determine the optimal number of clusters k, you execute the k-means starting with k=1 and then repeat it several times with k={2, 3, …, n}. For each execution the Total\ Within\ cluster\ Sum\ of\ Squared\ Error=\sum_{k}\sum_{i}{r_{ik}\ *\ \left(x_i-\mu_k\right)^2} retained and saved. Then when for the chosen n times the k-means is executed, the Total Within cluster Sum of Squared Error is plotted against the respective k number of clusters.
Implementation in Python from Scratch
Implementation in Python with sklearn
Pros/Cons and nice to know about k-Means
While using the K-Means algorithm you should be aware of the properties and the advantages as well as the drawbacks of the approach.
Advantages
- Simplicity:
- The Implementation, Visualization and Interpretation are quite easy to realize.
- Variable algorithm:
- can be used with small and (efficiently) with large datasets
- is easily adjustable by changing the k parameter
- Good cluster building (in comparison with other cluster algorithms)
Drawbacks
- Algorithm needs the user to provide the number of clusters
- Initialization of cluster centroids can lead to problems
- The observations chosen as the first centroids at the beginning of the algorithm are somehow determining the success of the algorithm: If the centroids are chosen too close to each other the cluster building process doesn’t lead to an optimal result. Methods such as k++ remedy the problem as good as possible.
- With > 1 variable standardization is necessary
- If one variable is on a larger scale as the other variables, it will dominate the cluster building and the information lying in the other variables is less or not taken into consideration
The pros & cons of the algorithm should always be kept in mind when using the algorithm because the non-consideration of these points can lead to severe discords within the algorithm linked with incorrect results.
The present article shifted the focus on the popular K-Means algorithm and illustrated the concept, the mathematical background as well as the implementation in Python and further information about the approach. The algorithm embodies a strong standing pillar in the tool set of a data scientist, because of its efficiency as well as its effectivity on several levels and is therefore an important tool to know.
Sources
- Dasgupta, Sanjoy (2008): Lecture 2 — The k-means clustering problem. Lecture Material. UC San Diego, Jacobs School of Engineering, Computer Science and Engineering logo.
- Deckert, Dirk André (2018): Unsupervised Learning. Lecture Material. University of Munich, Munich. Online verfügbar unter http://www.mathematik.uni-muenchen.de/~deckert/teaching/WS1819/ATML/arman_unsupervised_learning.pdf.
- Ertel, Wolfgang (2016): Grundkurs Künstliche Intelligenz. Eine praxisorientierte Einführung. 4., überarbeitete Auflage. Wiesbaden: Springer Vieweg (Computational Intelligence).
- Hastie, Trevor; Tibshirani, Robert; Friedman, Jerome H. (2017): The elements of statistical learning. Data mining, inference, and prediction. Second edition, corrected at 12th printing 2017. New York, NY: Springer (Springer series in statistics).
- Henrique, Alexandre (2019): Clustering with K-means: simple yet powerful. Hg. v. medium.com. Online verfügbar unter https://medium.com/@alexandre.hsd/everything-you-need-to-know-about-clustering-with-k-means-722f743ef1c4, zuletzt aktualisiert am 2019.
- Holling, Heinz; Gediga, Günther (2010 // 2011): Statistik – deskriptive Verfahren. 1. Aufl. Göttingen: Hogrefe Verlag.
- James, Gareth; Witten, Daniela; Hastie, Trevor; Tibshirani, Robert (2017): An introduction to statistical learning. With applications in R. Corrected at 8th printing. New York, Heidelberg, Dordrecht, London: Springer (Springer texts in statistics).
- Kodinariya, Trupti M.; Makwana, Prashant R. (2013): Review on determining number of Cluster in K-Means Clustering. In: International Journal of Advance Research in Computer Science and Management Studies 1 (6), S. 90–95.
- Lorraine (2019): K-Means Clustering with scikit-learn. Hg. v. dev.to. Online verfügbar unter https://dev.to/nexttech/k-means-clustering-with-scikit-learn-14kk.
- Lucas (2015): A proof of total sum of squares being equal to within-cluster sum of squares and between cluster sum of squares? [duplicate]. Hg. v. stats.stackexchange.com. Online verfügbar unter https://stats.stackexchange.com/questions/147007/a-proof-of-total-sum-of-squares-being-equal-to-within-cluster-sum-of-squares-and.
- Ng, Andrew (2017): CS229 Lecture notes. The k-means clustering algorithm. Stanford University, Stanford.
- Ostrovsky, Rafail; Rabani, Yuval; Schulman, Leonard J.; Swamy, Chaitanya (2006): The Effectiveness of Lloyd-Type Methods for the k-Means Problem. In: 2006 47th Annual IEEE Symposium on Foundations of Computer Science (FOCS’06).
- Pérez-Ortega, Joaquin; Almanza-Ortega, Nelva Nely; Vega-Villalobos, Andrea; Pazos-Rangel, Rodolfo; Zavala-Diaz, Crispin; Martinez-Rebollar, Alicia et al. (n.a.): The K-Means Algorithm Evolution. Hg. v. IntechOpen. Online verfügbar unter https://www.intechopen.com/online-first/the-k-means-algorithm-evolution.
- unknown Author (2018): Pros and Cons of K-Means Clustering. Online verfügbar unter https://www.prosancons.com/education/pros-and-cons-of-k-means-clustering/.

